While investigating Rwandan political violence, we also engaged in some other efforts along the way to better understand the context. Two are provided below: one a survey of Rwandan citizens and another a content analysis of the international media. We also provide information regarding Rwandan censi that are not easily obtained - specifically 1991. Censi from 2005 are forthcoming. We are trying to track down Belgian censi as well. Other data is listed that was collected from others. These will all be posted when available.
A Survey of Butare
In our efforts to better understand what took place in Rwanda during 1994 as well as how individuals remembered these events, in 2001-2002 we engaged in numerous focus groups and one survey, the latter of which we provide below. Here, you will find the codebook for this effort as well as the raw data (Stata format).
Generating the sample for the survey required a little innovation on our part. As census records were believed to be useless, we selected a community that our enumerators were familiar with - Butare (where the national university of Rwanda is located along with the Centre for Conflict Management with whom we were working at the time). We then sent enumerators to one of the smallest geographic units (the commune - approximately 100 households) where they identified all households by physically walking around, writing them down and latter drawing them. At the time, we did not have access to the military maps that identified households at the 5 meter level. Selecting every 6th household, enumerators administered their questionaires.
Butare Survey Codebook - Word Format
Butare Survey - Stata Format
Media Coverage of Rwanda and the Death Count
When we began our research, we were aware that attention to Rwanda had been unsteady over time. This prompted us to more systematically track coverage of Rwanda. Below you will find data relevant to the country of Rwanda (all coverage as identified by Lexis Nexus) as well as a more specific focus on the number of victims within the violence of 1994.
Global Rwanda News Coverage 1985 to April 1999
What was the estimation of the number killed as reflected in the international media of the time
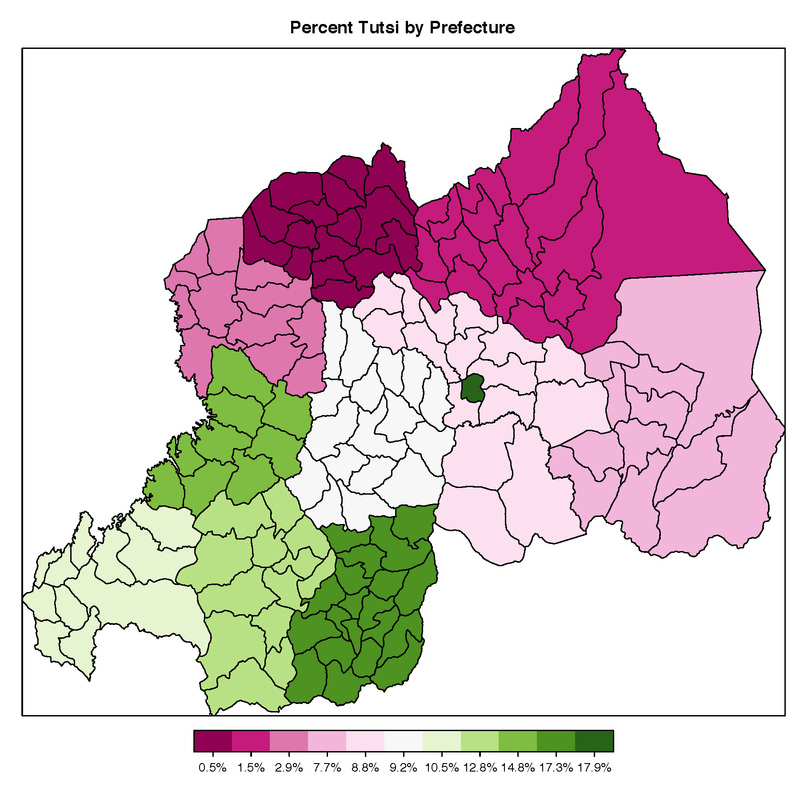
The Rwanda Census of 1991
Rwanda 1991 Census - PDF format
1991 Codebook for Census Coding - Word Document
1991 Census Data - Excel Format
A Survey of Butare
In our efforts to better understand what took place in Rwanda during 1994 as well as how individuals remembered these events, in 2001-2002 we engaged in numerous focus groups and one survey, the latter of which we provide below. Here, you will find the codebook for this effort as well as the raw data (Stata format).
Generating the sample for the survey required a little innovation on our part. As census records were believed to be useless, we selected a community that our enumerators were familiar with - Butare (where the national university of Rwanda is located along with the Centre for Conflict Management with whom we were working at the time). We then sent enumerators to one of the smallest geographic units (the commune - approximately 100 households) where they identified all households by physically walking around, writing them down and latter drawing them. At the time, we did not have access to the military maps that identified households at the 5 meter level. Selecting every 6th household, enumerators administered their questionaires.
Butare Survey Codebook - Word Format
Butare Survey - Stata Format
Media Coverage of Rwanda and the Death Count
When we began our research, we were aware that attention to Rwanda had been unsteady over time. This prompted us to more systematically track coverage of Rwanda. Below you will find data relevant to the country of Rwanda (all coverage as identified by Lexis Nexus) as well as a more specific focus on the number of victims within the violence of 1994.
Global Rwanda News Coverage 1985 to April 1999
What was the estimation of the number killed as reflected in the international media of the time
- Here are the list of articles searched for number killed
The Rwanda Census of 1991
Rwanda 1991 Census - PDF format
1991 Codebook for Census Coding - Word Document
1991 Census Data - Excel Format
The Rwandan Census of 2002
- SPSS format (sorry trying to find a better format)
The Rwandan Census of 2005
- Forthcoming
Administrative Boundaries in Rwanda - Current and Past
old to new cells by code_sector_district_province
Geographic Information
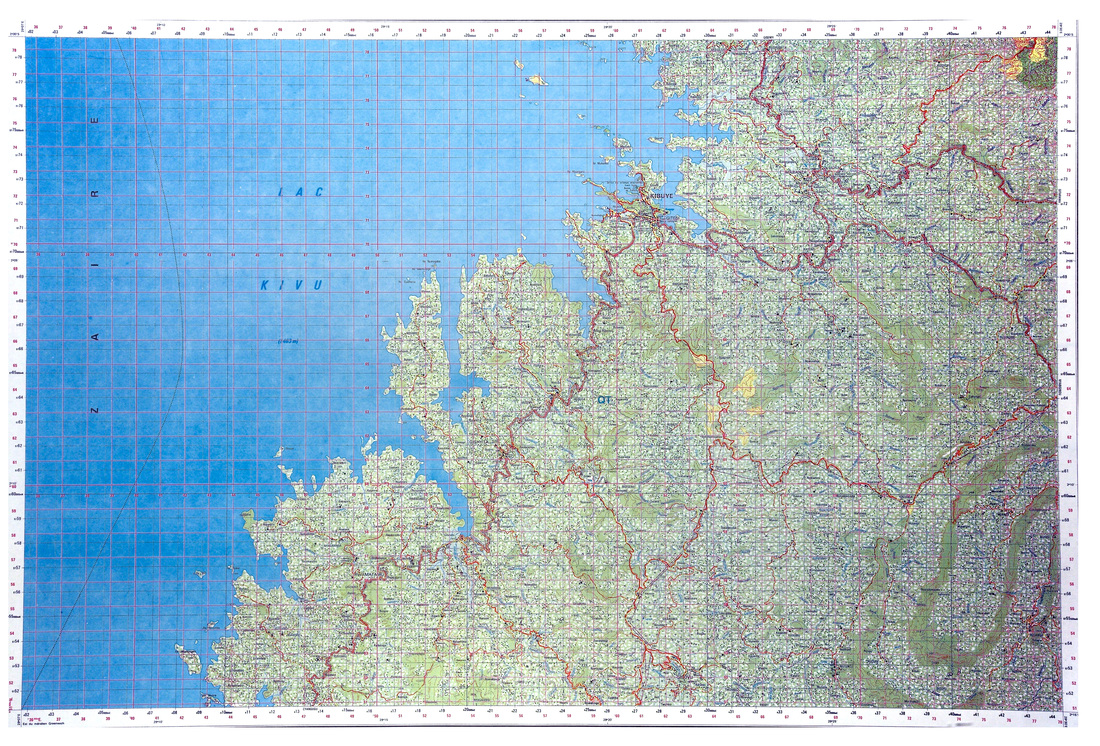
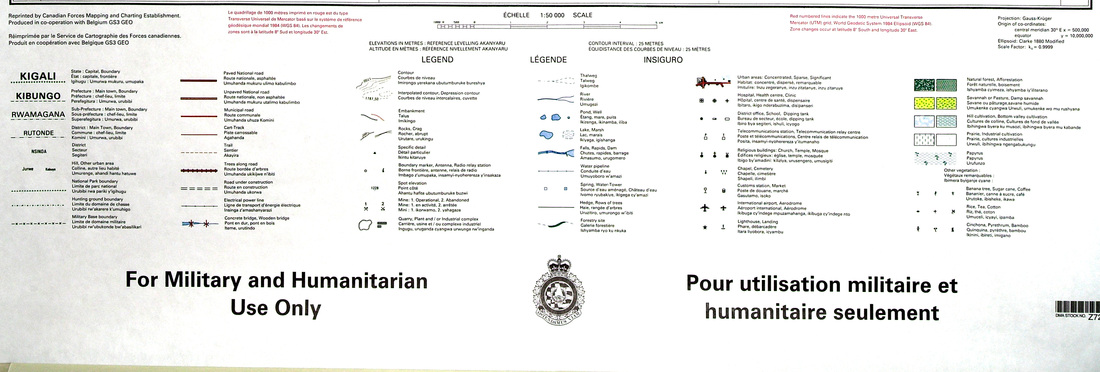
Satellite Images of Rwanda (Prior to the Violence)
- This is a sample but we have the whole country stitched together. If interested, contact us.
Migration data and Population data
Rwanda Radio Transcripts (total 727 from ICTR - forthcoming as we need to compress; sample of each provided)
- Directed Dyad database from Will Moore (coded from UNHCR) - format stata
- Asylum states
- General trends from UNHCR data
- Miscellaneous information regarding movement
- UN population estimates
Rwanda Radio Transcripts (total 727 from ICTR - forthcoming as we need to compress; sample of each provided)
- Radio Rwanda: English, French, Kinyarwanda
- Radio RTLM: English, French, Kinyarwanda
Other Data
Declassified CIA documents
Demobase Rwanda - Using the same methods applied to Pakistan, the Census Bureau mapped Rwanda, a country with a substantial,
dense rural population. Satellite imagery was combined with data from the 2002 Census of Rwanda to produce a geospatial distributed population layer.
World Data Atlas
- Massacre memo April 28, 1994
- Security deteriorating - April 8, 1994
- Ceasefire stalled - April 18, 1994
- Rebels Advancing - April 23, 1994
Demobase Rwanda - Using the same methods applied to Pakistan, the Census Bureau mapped Rwanda, a country with a substantial,
dense rural population. Satellite imagery was combined with data from the 2002 Census of Rwanda to produce a geospatial distributed population layer.
- Gridded population estimates, 2002 [ZIP - 8.5M]
- 2000-2015 population estimates for 1st, 2nd, and 3rd administrative levels [ZIP - 6.5M]
World Data Atlas
- Economy
- Energy
- Transportation
- Telecommunication
- National Defense
- Foreign Trade
- Exports of goods and services
- Exports of goods
- Exports of service
- Merchandise exports
- Food exports
- Fuel exports
- High-technology exports
- High-technology exports (% of manufactured exports)
- Imports of goods and services
- Imports of goods
- Imports of services
- Merchandise imports
- Food imports
- Fuel imports (% of merchandise imports)
- Tourism
- Environment
- World Rankings
- Demographics
- Land Use
- Agriculture
- Health
- Education
- Crime Statistics
- Poverty
- Food Security
- Water
- Research and Development
Looking for a copy
Aegis Trust Database (assessed from reading descriptions)
Primary question of interest
Primary question of interest
- Survey attempted to collect the names, date and method of death for all people killed in Kigali Ville during the 1994 Genocide
- December 2003- April 2004
- Study involved a door-to-door survey, conducted by University students, of all neighborhoods of Kigali Ville and parts of Kigali Rural. The survey included questions regarding the date and method of death of victims in that area.
- Kigali Ville and parts of Kigali Rural
- 200 interviewers at the height of the project
- Project was sponsored by the National Genocide Memorial which was likely increases participation and the quantity of information gathered
- The project was completed in a short period of time and surveyed only people living in Kigali Ville and Kigali Rural at the time that the study was completed. Training remains an issue throughout most large scale studies conducted in Rwanda.